GNUPLOT 以函数或数据资料为绘制图形的来源。此两者皆使用 plot(splot) 指令绘图,plot 用于绘制 2 维的函数或数据资料;而 splot 则用以绘制 3 维空间 中的曲面。其基本语法为:
    plot {ranges} {<function> | {"<datafile>" {using ...}}}
                  {title} {style} {, <function> {title} {style}...}

    splot {ranges} {<function> | {"<datafile>" {index i} {using ...}}}
                   {title} {style} {, <function> {title} {style}...}
由修改各参数的设定,可产生许多种表达图形的方式。 其参数的设定大致分为以下四类:
设定此次 plot(splot) 所显示的范围。在设定绘图环境中亦有 xrange、yrange、 zrange、rrange、trange、urange、vrange 等相似功能的参数可加以设定, 但其影响设定后所有的绘图状态。设定 range 的语法为:
[{<dummy-var> =} {<xmin> : <xmax>}] { [{<ymin> : <ymax>}] }
其中参数 <dummy-var> 为变数名称 (预设为 X Y,可由 set dummy 而更改), 而 min 和 max 则是设定显示范围,均为常数表示式。并非 min 和 max 要同时存在, 不设定表示不改变此项数值。一但设定了 range 之后,会自动将 autoscaling 关闭。 以下是一些范例:
  plot cos(x)                          # 使用目前的 range。
  plot [-10:30] sin(pi*x)/(pi*x)       # 设定 X range。
  plot [t = -10 :30]  sin(pi*t)/(pi*t) # dummy-variable 改成 t,设定 t range。
  plot [-pi:pi] [-3:3]  tan(x), 1/x    # 设定 X 和 Y range。
  # 仅设定 Y range,但关闭 X 轴 、Y 轴 的 autoscaling。
  plot [ ] [-2:sin(5)*-8] sin(x)**besj0(x)
  plot [:200] [-pi:]  exp(sin(x))      # 仅设定 xmax 和 ymin。
  splot [0:3] [1:4] [-1:1] x*y         # 设定 X、Y、Z range。
函数为一数学表示式。可以是 GNUPLOT 提供的函数或是自行定义或合成的函数。 若使用参数式 (parametric function),则可能是一对 (使用 plot) 或 3 个 (使用 splot) 数学表示式。要注意的是 dummy variable 必须符合当时所设定的, 一般为 X、Y、Z,若为参数式则为 t (2 维) 或 u v (3 维)。以下是一些范例:
  plot sin(x)   # 描绘数学三角函数 sin(x)。
  splot x * y   # 描绘函数 x*y。
GNUPLOT 依照档案中的数据,逐点描出图形。表4 即是一组数据资料。
#
#  datafile.example
#
0       11.062  9.757   12.667  2.345
2       9.212   8.0908  10.932  1.725
5       8.55    7.6612  9.0388  2.846
10      8.122   7.327   8.617   0.957
15      8.156   7.6101  8.9019  1.577
20      8.122   7.5431  8.8009  3.141
25      7.988   6.3007  9.2753  1.57
27      8.096   6.665   10.555  2.172
29      7.936   6.9395  8.325   0.582
30      7.854   6.4909  9.8171  0.603
35      8.01    7.1556  8.644   1.063
40      8.02    7.0301  9.7099  2.152
45      8.092   6.9164  9.7676  1.44
50      8.072   7.2993  8.4447  1.96
60      8.286   7.7265  8.755   1.0
表4: An example of datafile.(I)
    plot "datafile" { using { <ycol> |
                              <xcol>:<ycol> |
                              <xcol>:<ycol>:<ydelta> |
                              <xcol>:<ycol>:<ylow>:<yhigh> |
                              <xcol>:<ycol>:<ylow>:<yhigh>:<boxwidth> }
                            {"<scanf string>"} } ...

    splot "datafile" { using { <xcol>:<ycol>:<zcol> | <zcol> }
                             {"<scanf string>"} } ...
由 plot "datafile" with lines即能产生如图23 的
结果。此例中 GNUPLOT 依序用线条连接档案 "datafile" 内各点数据所定出的座标值。
将第一栏位视为 X 座标值,将第二栏位视为 Y 座标值。表4
为一组资料档案。参数 <xcol> <ycol> 和 <zcol>
均为在档案中选择适当的栏位分别做为 X、Y、Z 的座标值。
如在 plot 语法中第一行仅用 <ycol> 则以档案中的行数代替 X 座标值
绘出图形。第二行则为同时标出 X、Y 座标值。第三、四行为画 errorbars 时
使用 <ydelta>、<ylow> 及 <yhigh>。第五行为画 boxes
或 boxerrorbars 时使用,可设定 box 的宽度;此时若以 boxes 为图样
(即不必使用 <ylow> 及 <yhigh>),亦要设定 <ylow>
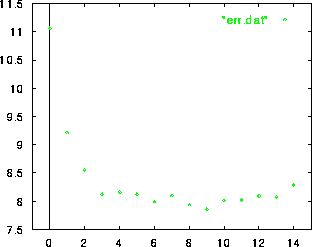
及 <yhigh>。图13 即是使用表4 为 datafile 运用不同
叙述所绘的结果。

set xrange [-1 : 15]
plot "datafile" using 2
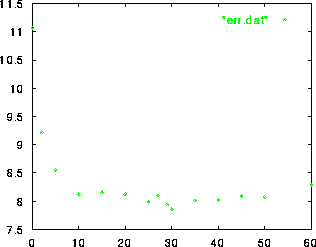
plot "datafile" using 1:2
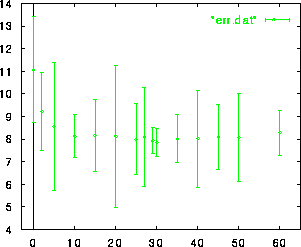
set xrange [-3 : 65]
plot "datafile" using 1:2:5 with errorbars
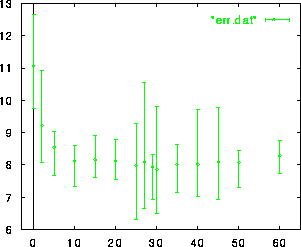
set xrange [-3 : 65]
plot "datafile" using 1:2:3:4 with errorbars
plot 语法中第六行是采用 C 语言中 scanf 读入浮点数字的 语法 %f 来表达使用数字的情形。
plot "datafile" using "%*f%f%*20[^\n]%f" with lines
是忽略第一行栏位的数字,采用第二栏位的数字为 X 座标值,再忽略 20 个
非换行字元的文字,再将接者的数字做为 Y 座标值。这样就可忽略数字之间的文
字说明了。如 6.2.3 节中由设定输出为 table 所产生的资料
档案 "datafile" 。可用
plot "datafile" using "%*4[^\n]%f%3[^\n]%f" with lines
得到 "datafile" 所描述的图形。使用 %*4[^\n] 忽略前四个字
"i x=" %*3[^\n] 忽略 " y=" 三个字。
储存档案中的数据或许未按大小顺序排列者,此时使用 "points" 为图样画出数据 尚无影响。但若使用 "lines" 为图样画出数据,则图形显得杂乱。如图12 左半部,此时可用 unix 指令
sort -n data.old > data.new
将数据依顺序,由小而大排列。则将图12 左半部改成图12 右半部。
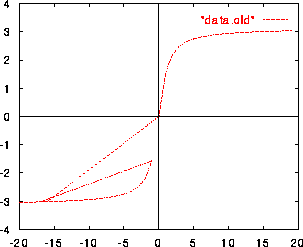

图 12: Plotting unsorted and sorted data
这方法适用于 2 维上的绘图,至于 3 维上绘图 则须设定 dgrid3d 此项参数。
在一档案中亦可包含几个数值资料图形,只要在不同数值资料图形之间以两行 空白隔开,就可仅画其中一个数值资料图形(仅能运用于画 3D 图形)。范例如下:
splot "datafile" index 0
datafile 内容如表5 ,index 0 表示画第一个数值资料图形。 此时若要画第三个图形,可使用 index 2。
#  index 0
0  11.062   9.757
2   9.212   8.0908
     .
     .


#  index 1
10   8.122  7.327
15   8.156  7.6101
      .
      .


#  index 2
25   7.988  6.3007
27   8.096  6.665
      .
      .
表5: An example of datafile.(II)
GNUPLOT 描绘数据资料图形是以读入档案中的座标值后,以图样绘上。 而描绘函数图形是计算若干点的函数值后,以某种图样将函数值绘上。 一般是取样 100 点及采取线条作为图样。GNUPLOT 可提供 9 种图样,分别是
plot sin(x) with lines 。
plot sin(x) with points。
plot sin(x) with linespoints 。
plot sin(x) with impulses 。
plot sin(x) with dots 。
plot sin(x) with steps 。
 plot sin(x) with
       errorbars
。
 plot
       sin(x) with boxes
。
plot sin(x) with boxerrorbars 。
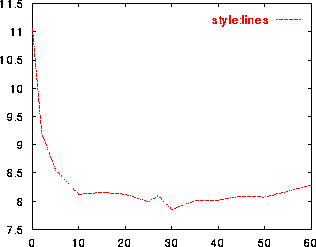
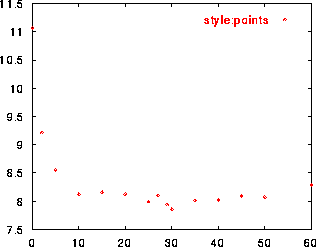
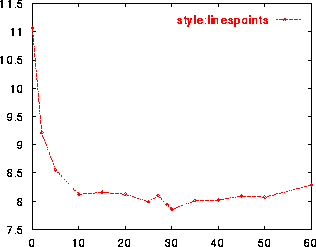
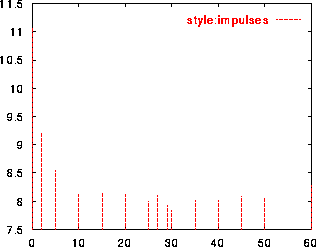
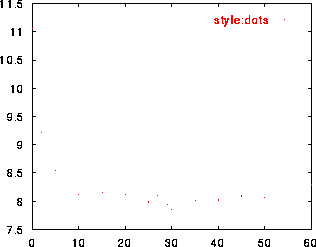
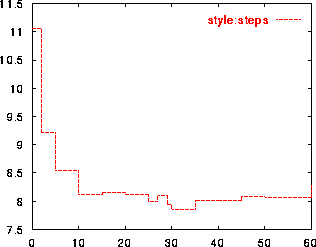
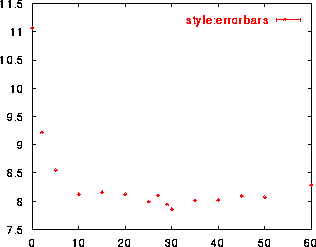
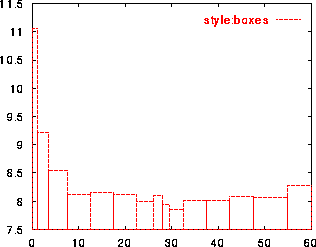
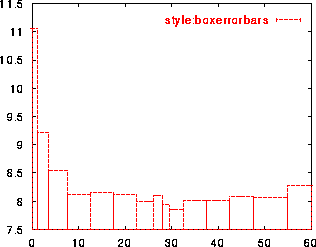
图14: Various plotting style
若改变图样,则可得到不同形式的输出。图14 以九种图样为范例分别 绘出数值资料图形。其中 errorbars, steps, boxes 和 boxerrorbars 仅能在平面 (2D) 上使用。在设定绘图环境之中, 亦可由 set function style 和 set data style 分别设定描绘函数与数据资料 的图形,得到相同的结果。
设定图样的语法为
with <style> {<linetyle> {<pointtype>}}
其中参数 <style> 为 lines, points, linespoints, impulses, dots, steps, errorbars 之中一种, 参数 <linetype> 和 <pointtype> 均为一正数,分别选定绘图颜色及 画 points 的符号。GNUPLOT 提供 <linetype> 和 <pointtype> 各六种选择,供绘图循环使用。以下举出一些使用范例:
plot sin(x) with impulses
splot x*y with points, x**2 + y**2
splot x**2 + y**2 with lines 1, x**2 - y**2 with lines 1
plot sin(x) with linespoints 1 3, cos(x) with linespoints 1 4
一般使用 GNUPLOT 绘图时,会将函数名称或存有数据资料的档案名称设定为 title。我们可用
title "<title>"改变 title。如图14 中即是运用
plot "datafile" title "style : lines" with lines将名称由描述档案名称改为描述图案名称。我们亦可使用 "notitle" 使 title 不出现。 如
plot my_function(x), 1 notitle不将函数名称 "1" 显示在图形上,而得到 y=1 直线,而这条直线可作为辅助线。